CONNECT is a Ground–Breaking Powerful Business Diagnostics and Transformation Engine
CONNECT provides incredible visualisation of your organisation’s performance in areas like Strategy Delivery, Portfolio Management, Programmes, Projects, GRC, and many others, providing unique insights into problems and risks, empowering you to make effective, timely, data driven decisions
What is CONNECT?
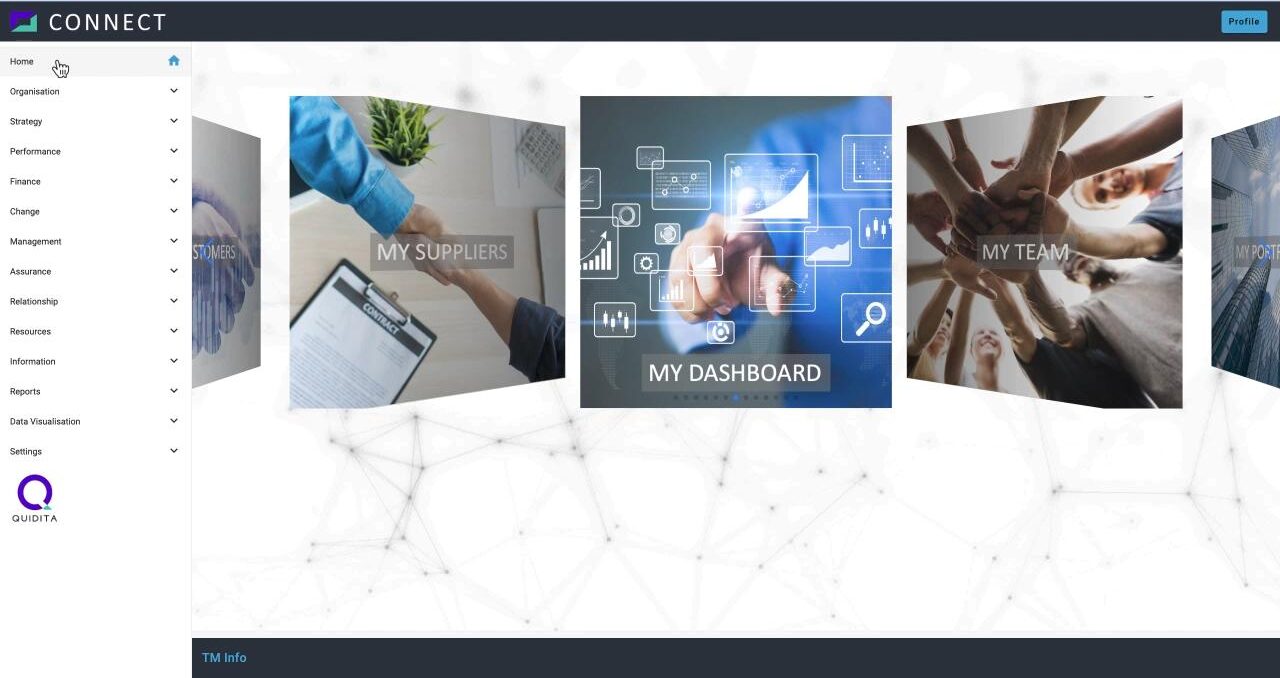
Connect is a cloud-based application which allows you to see how multiple aspects of your organisation are performing, either in a very targeted way (e.g. risk management in a given department or project), or across the entire organisation (e.g. strategy execution).
Connect bridges the information silos in your organisation, showing you the relationships between the things that your organisation does and that you need to understand.
It does the hard work of managing the complexity behind the relationships between the things that go on in your organisation, at the most detailed level and in near real time.
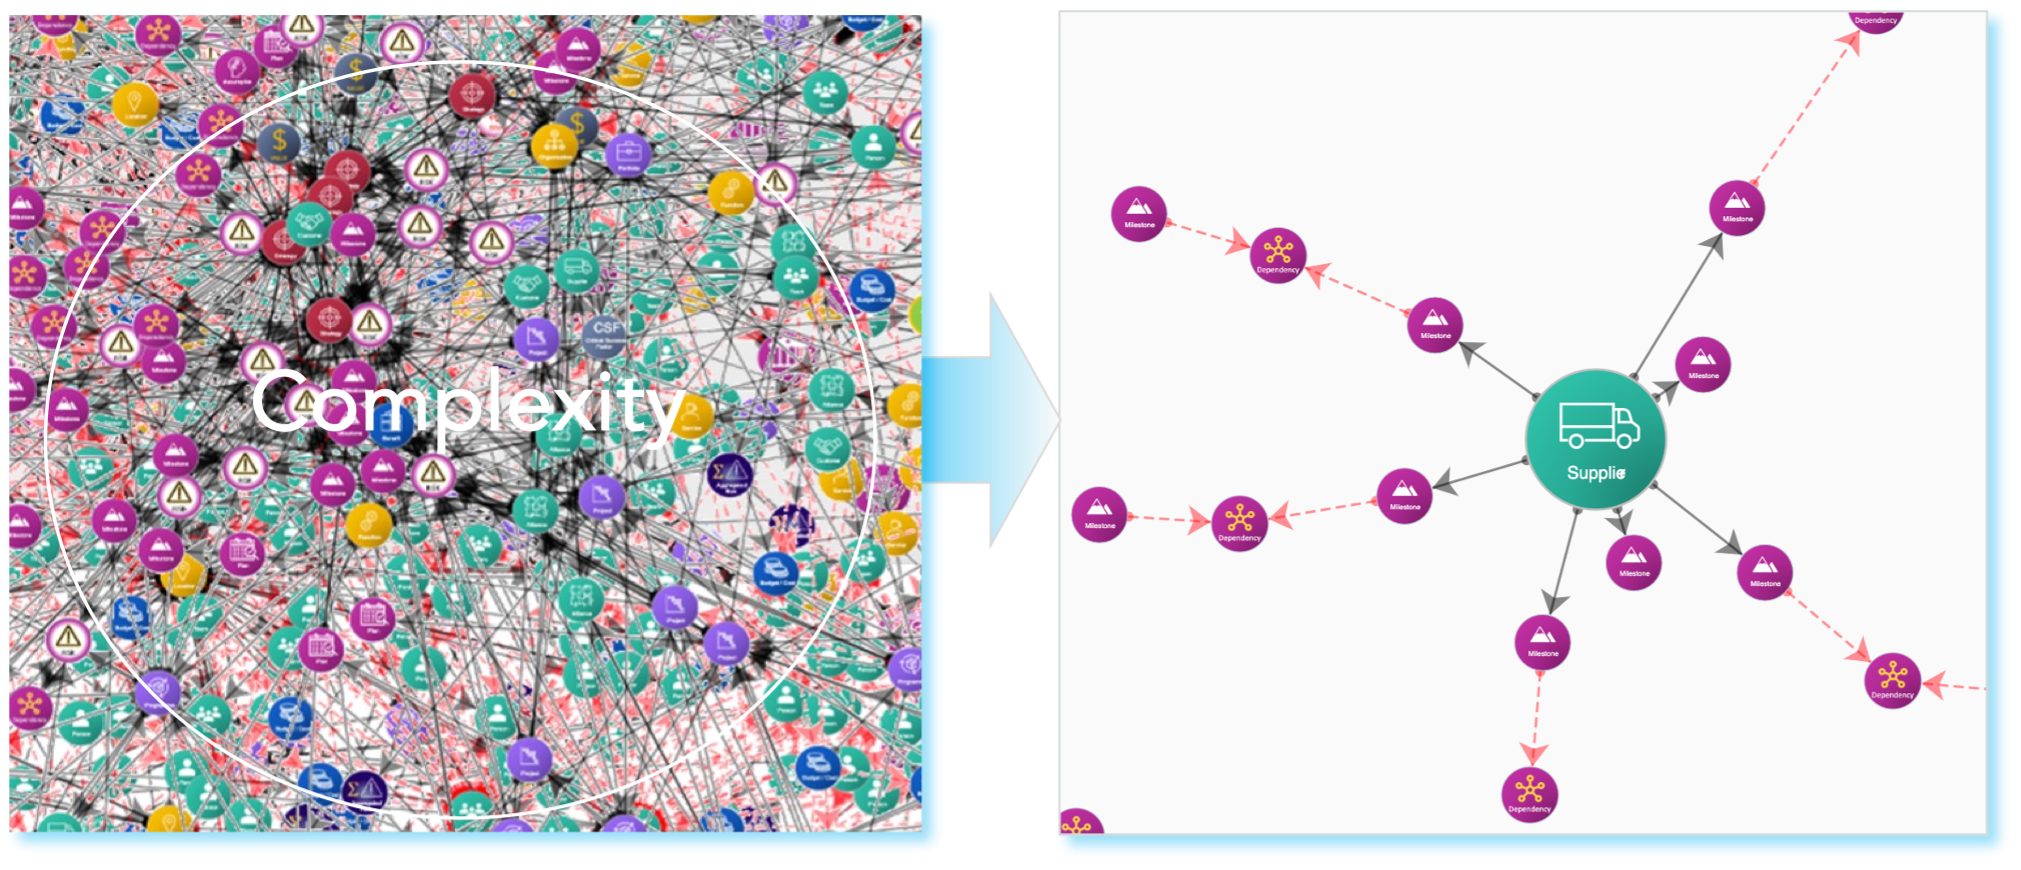
For example, assume there is an issue with a given supplier – as depicted below, Connect instantly shows all the areas in the organisation that are impacted by that issue, allowing you to be pro-active about mitigating the effects of that impact.
While Connect manages the complexity that people have not been able to in the past, which has contributed to the problems described in the “Your Challenges” section, its real strength comes from its ability to cut through all the complexity and reveal, simply and with incredible data visualisation, those things that need attention – focused, actionable, near real-time insights from completely joined up information at any required level of detail.
Connect gives you the strategic and operational oversight that enables you to take pro-active, data driven decisions that help your organisation ensure that it delivers its objectives.
Components
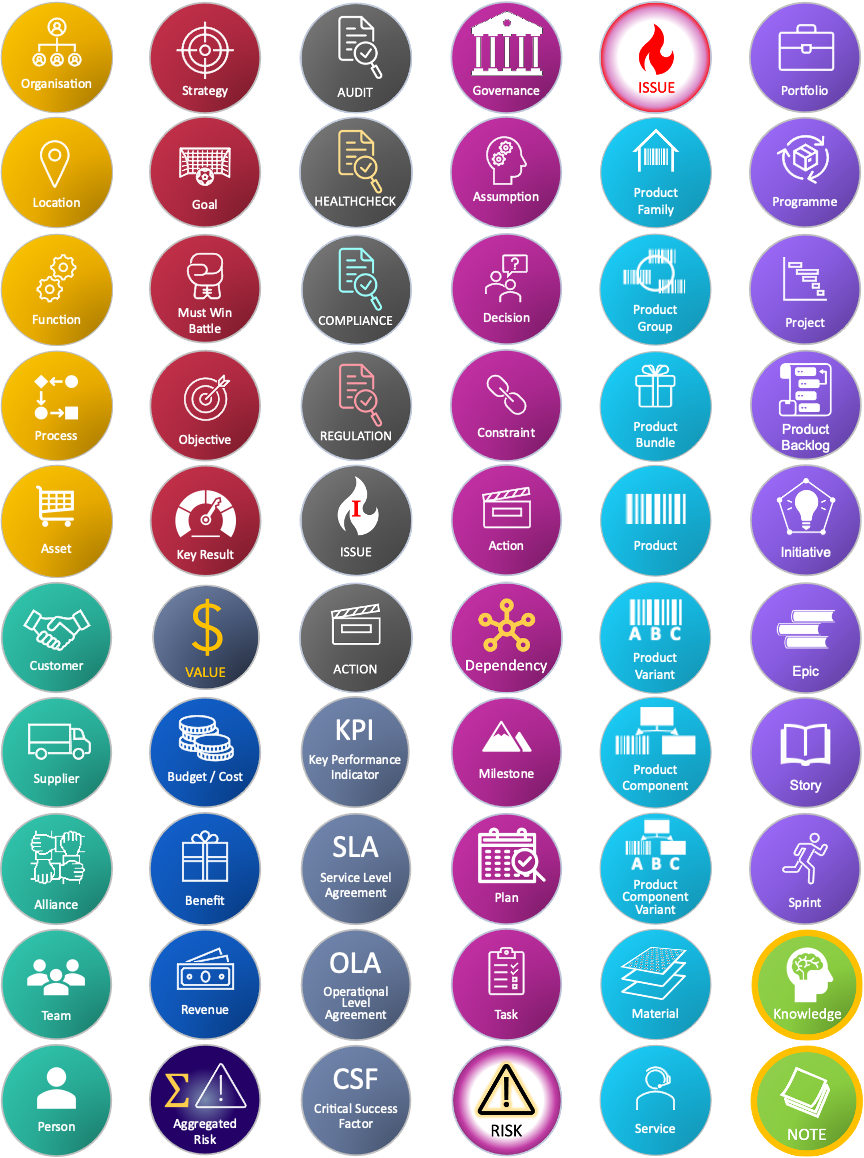
Quidita broke down what any organisation is and what any organisation does into a set of “building blocks” which we call Component Types – a selection of these is pictured below.
Component Types include things like Strategy, Goals, OKRs, Functions/Departments, Locations, Change Portfolios, Projects, Budgets, Benefit Realisation, Plans, Actions, Tasks, Issues, Risks, Dependencies, Sprints, Products, SLAs, OLAs KPIs, Resources, Suppliers, Customers and many more.
Each instance of a Component Type (a Component) contains data about the Component that is essentially a record in a database. Connect does some unique things with Components that are achieved because of how we have designed the database.
Some Component Types are designed to contain very little information while others contain considerable amounts of information.
Connect provides all the functionality to manage the data in any Component of any type from a browser. Alternatively, data can be imported into Components from your systems and datastores.
You can also take a hybrid approach where some of the data in a Component is imported, while data that does not exist in your systems, but adds value to your organisation, can be manually added and maintained on that Component through using Connect.
Some of the Components in Connect are displayed below. New Component Types are created by Quidita from time to time and those that are “non-client specific” will be available to all our customers at no additional cost as soon as they are released.
Connections / Relationships
You can see from the table of Component Types shown in the above “Connect section that things that might normally be tied together in other applications (e.g. Plans, Tasks, Milestones might only be accessible through a Project Management tool) are treated as individual Component Types by Connect.
This is one of the uniquely powerful concepts behind Connect – it does not dictate how you organise your organisation or your information. Instead, it allows you reflect “the way things really are” in your organisation – there are no limitations or restrictions to this.
Any Component can be connected to as many other Components as it has relationships with across the organisation. This can be done by any user, at any time.
As an example:
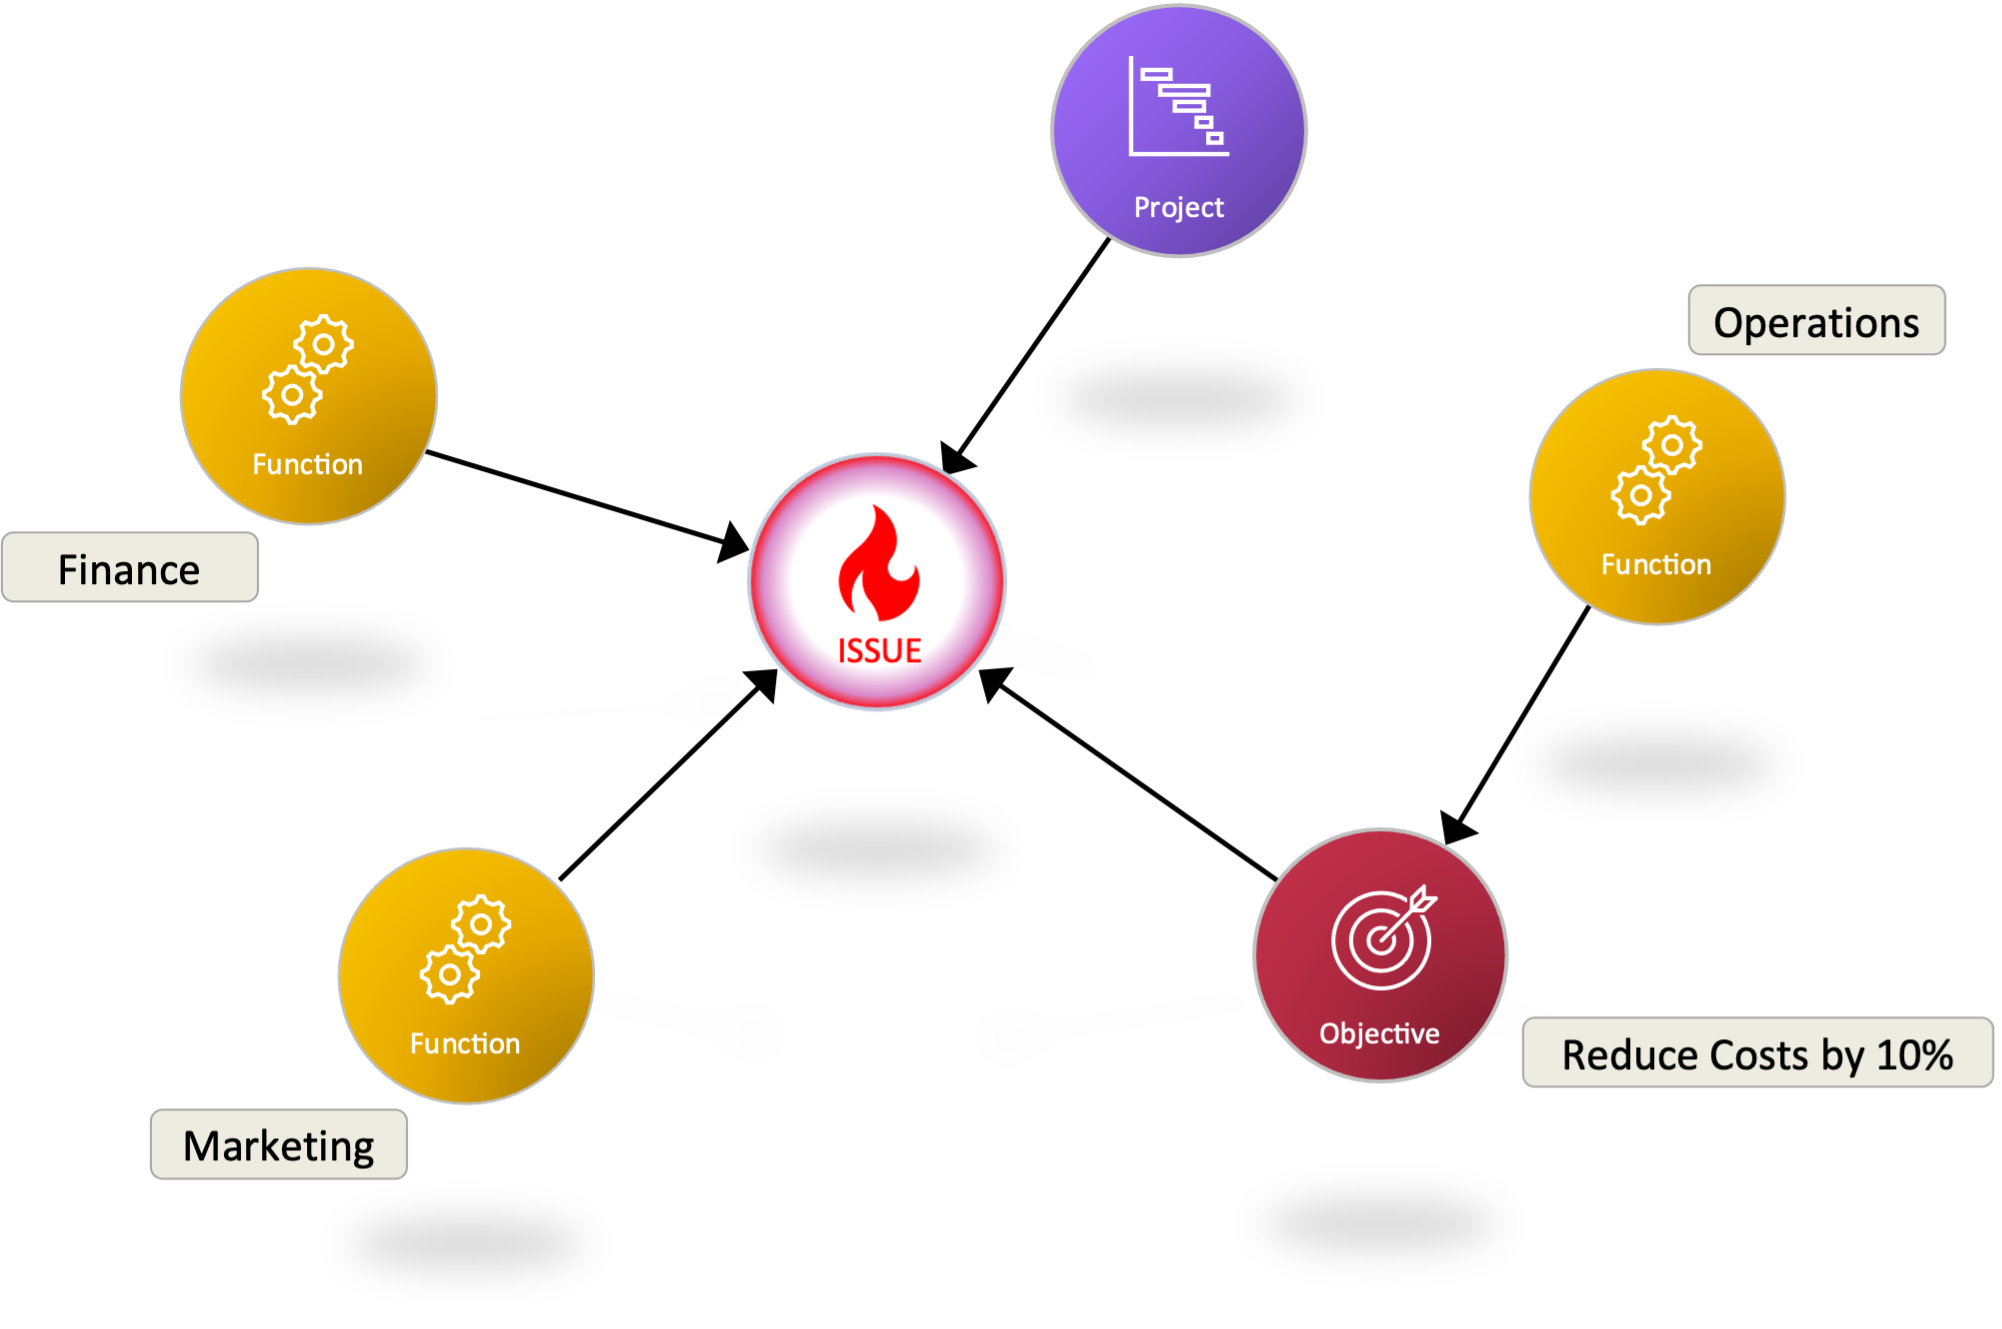
An issue that is being managed by a project may also be an issue for the Finance department and for Marketing and for Operation’s targets etc. Hence the issue has a relationship with 4 things, not just 1 and Connect makes it really easy for any user to connect any Component to any other Component.
Each of the departments (functions) impacted by the issue are aware of it and can see what progress is being made to resolve it at any time, enabling them to be pro-active in taking any steps that may be needed to mitigate any potential negative impacts on them. The visualisation of this example on Connect would look like this:
The Power of Connected Components
Connecting any aspect of an organisation with other things that it has relationships with, results in a complicated picture, but one which Connect is more than capable of managing.
However, the important thing is that Connect gets to understand all key relationships as it grows and is able to manage information about how any aspect of your organisation is performing. Because of this, Connect can use everything that it knows about an organisation to able to automatically generate insights and reports that have not been attainable until now.
An example of the power of Connect can be seen below. This output gets generated automatically in response to the question – “will I deliver my strategy?”.
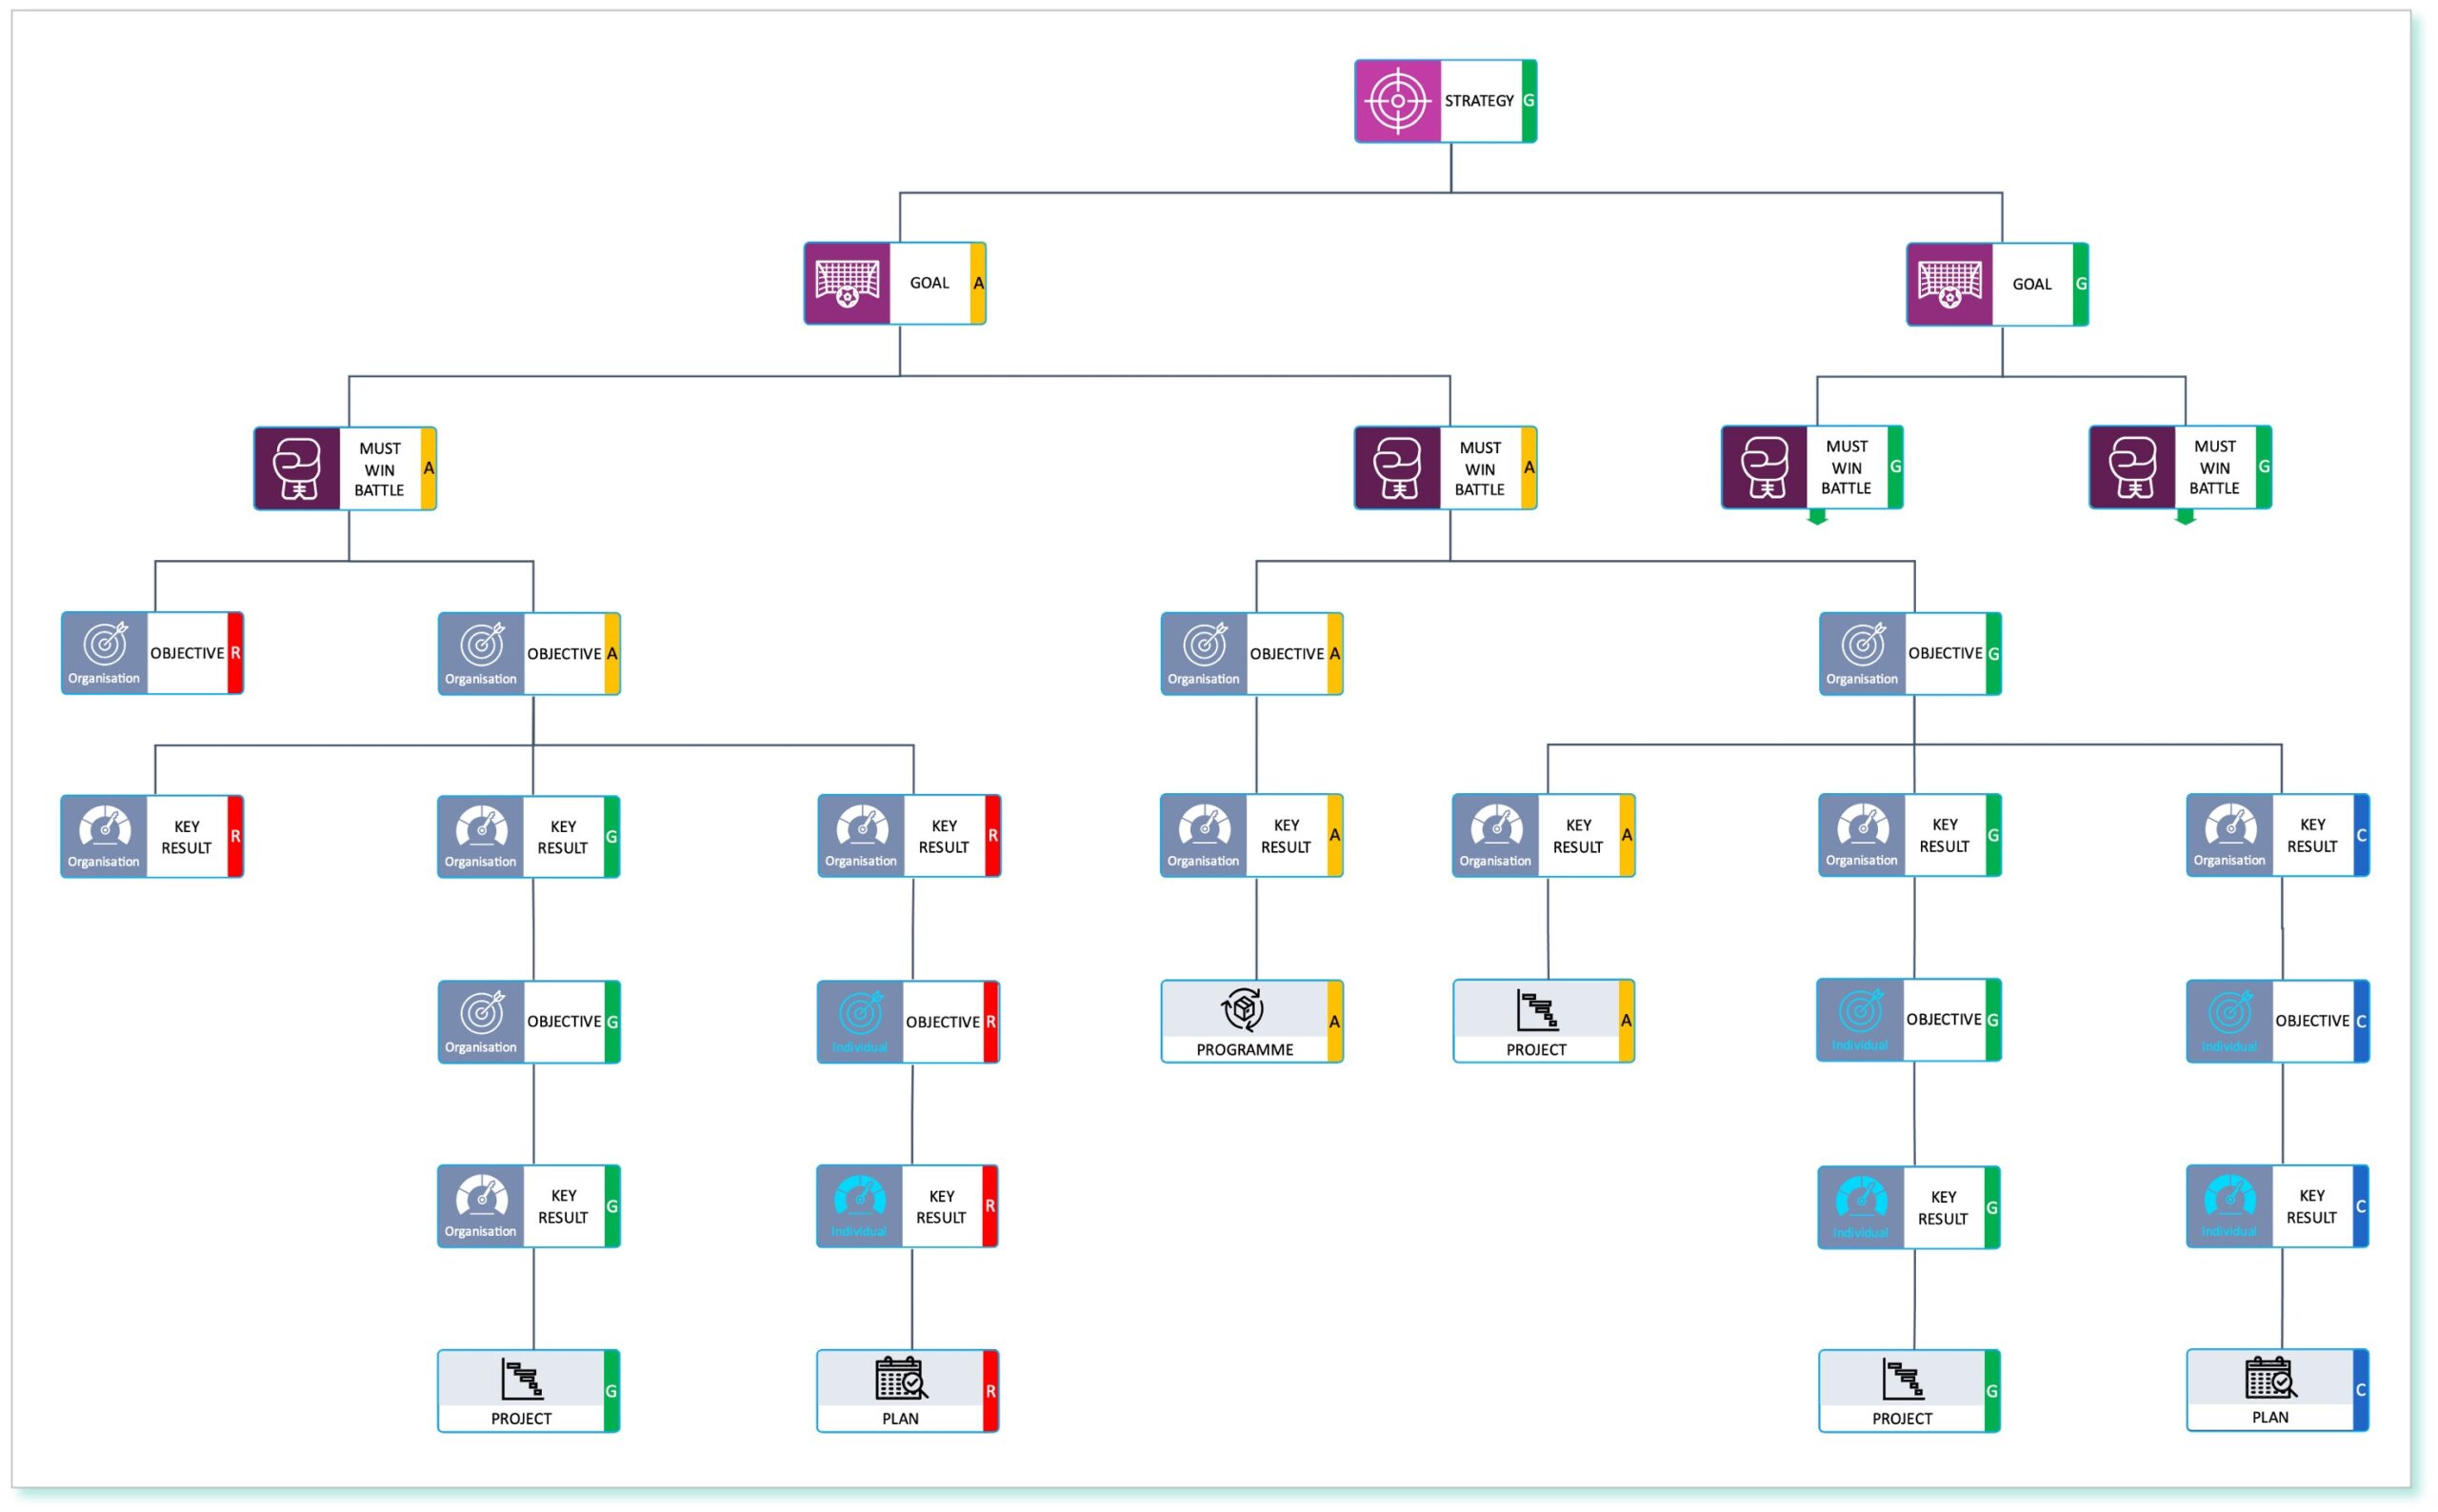
The above output shows all the elements that contribute to the management and delivery of a strategy and the status of each element. In this example the strategy has two strategic Goals and these each have two “Must Win Battles” ( MWBs – goals that must be delivered in a given year).
The Objectives that flow down from each MWB describe what needs to be done to deliver that MWB. The Key Results Components attached to any Objective Component each contain the measures that collectively define when that Objective has been met.
Objectives and Key Results (OKRs) can stay at an organisational level and be the responsibility of that part of the organisation to deliver (e.g. the finance department), or they can flow down the organisation to become Personal OKRs. Organisational OKRs are shown with white symbols in the above output and Personal OKRs with cyan symbols.
Each Key Result at the end of a chain should be connected to a task, or a plan, or a project or a programme etc, that defines how the Key Result is to be met. In Connect each of these have further levels of detail that define progress, issues, risks, dependencies etc.
Critically, the live status (as stored in Connect) of every aspect of “Strategy to Execution” is displayed in the output, showing where attention is required to help ensure a successful delivery.
Cutting Through Complexity
This section provides a simple example of how Connect cuts through organisational complexity to provide valuable and actionable insights using one of its many data visualisation options.
In the three extracts from Connect shown below, the first image (Fig 1) shows about 0.01% of the typical interactions between various things in a typical (fictitious) organisation of 150 people. The purpose of this image is simply to show a section of the Components that that have been created and the complexity of the interactions between them.
Fig 1: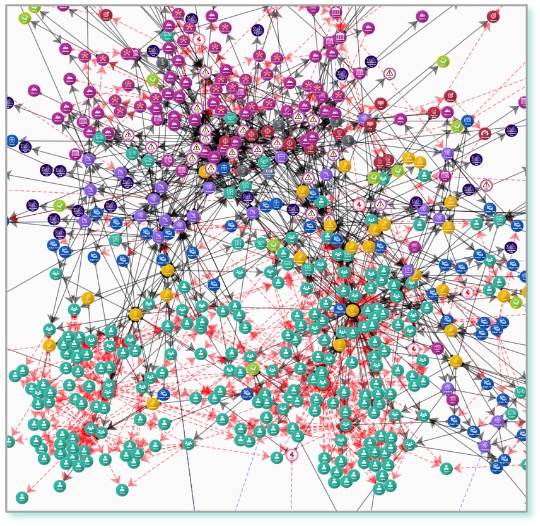
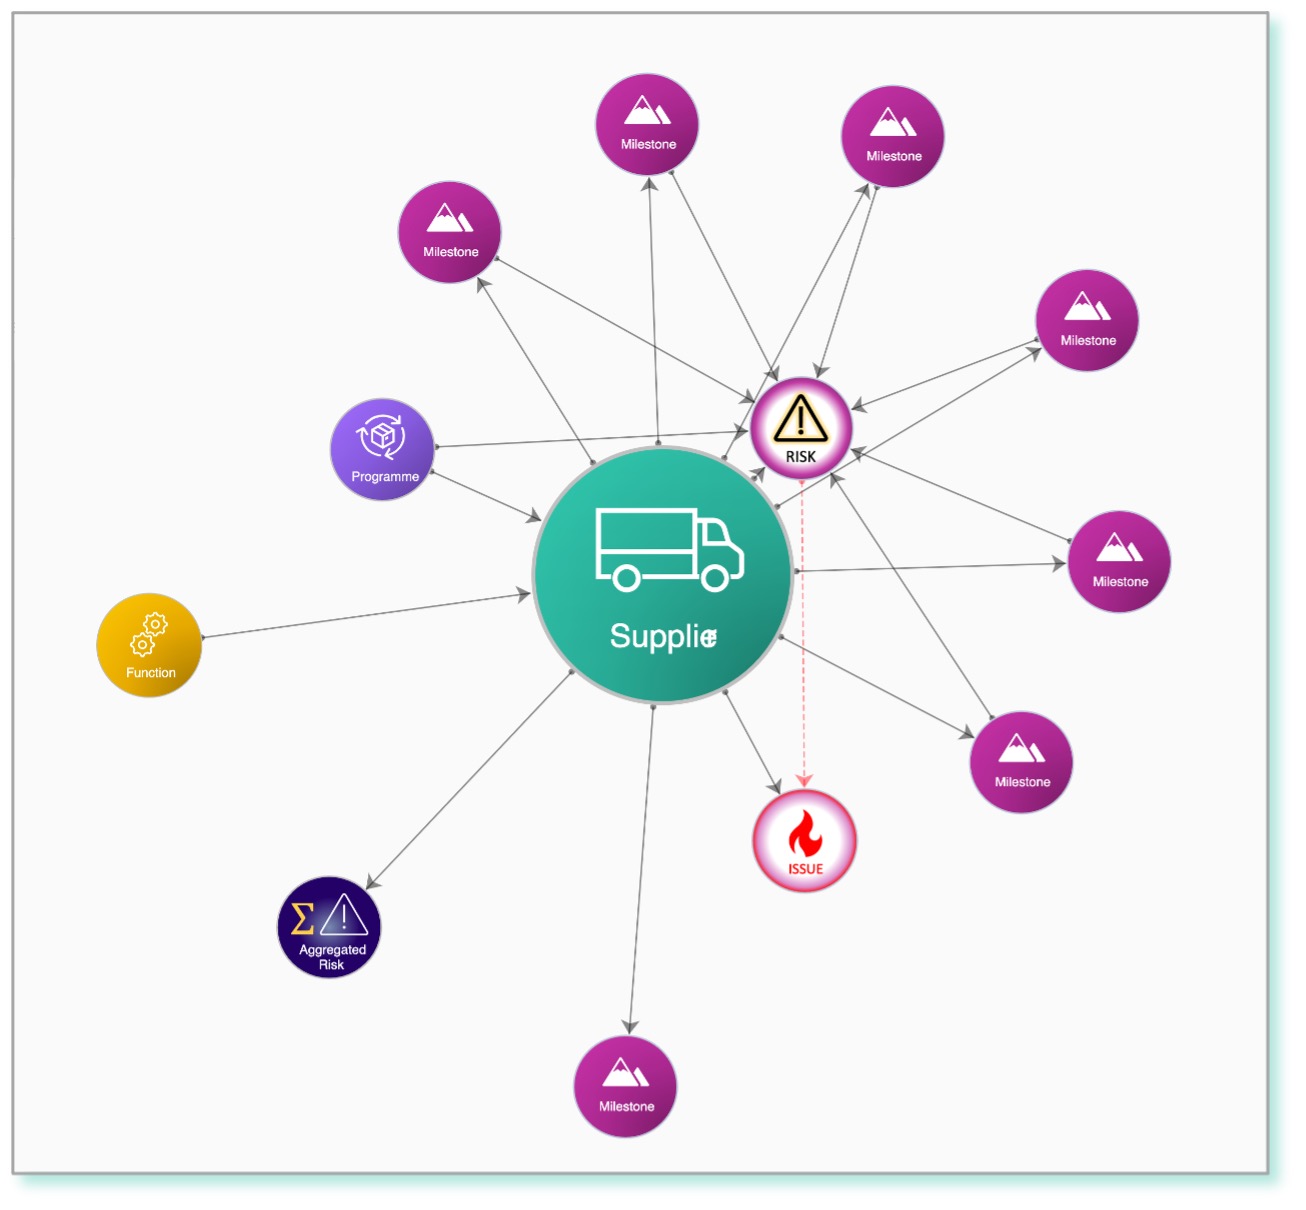
The second image (Fig 2) is a typical drill-down image, showing all the Components connected to a selected Supplier Component. This clearly shows that this supplier has 7 delivery Milestones.
Fig 2:
The third image (Fig 3) shows the power of Connect. Here Connect has cut through all the complexity to show all the dependencies that exist between the 7 supplier milestones and any other delivery milestones across the entire organisation. You can see that there are several “chains” of interdependent milestones.
Fig 3:
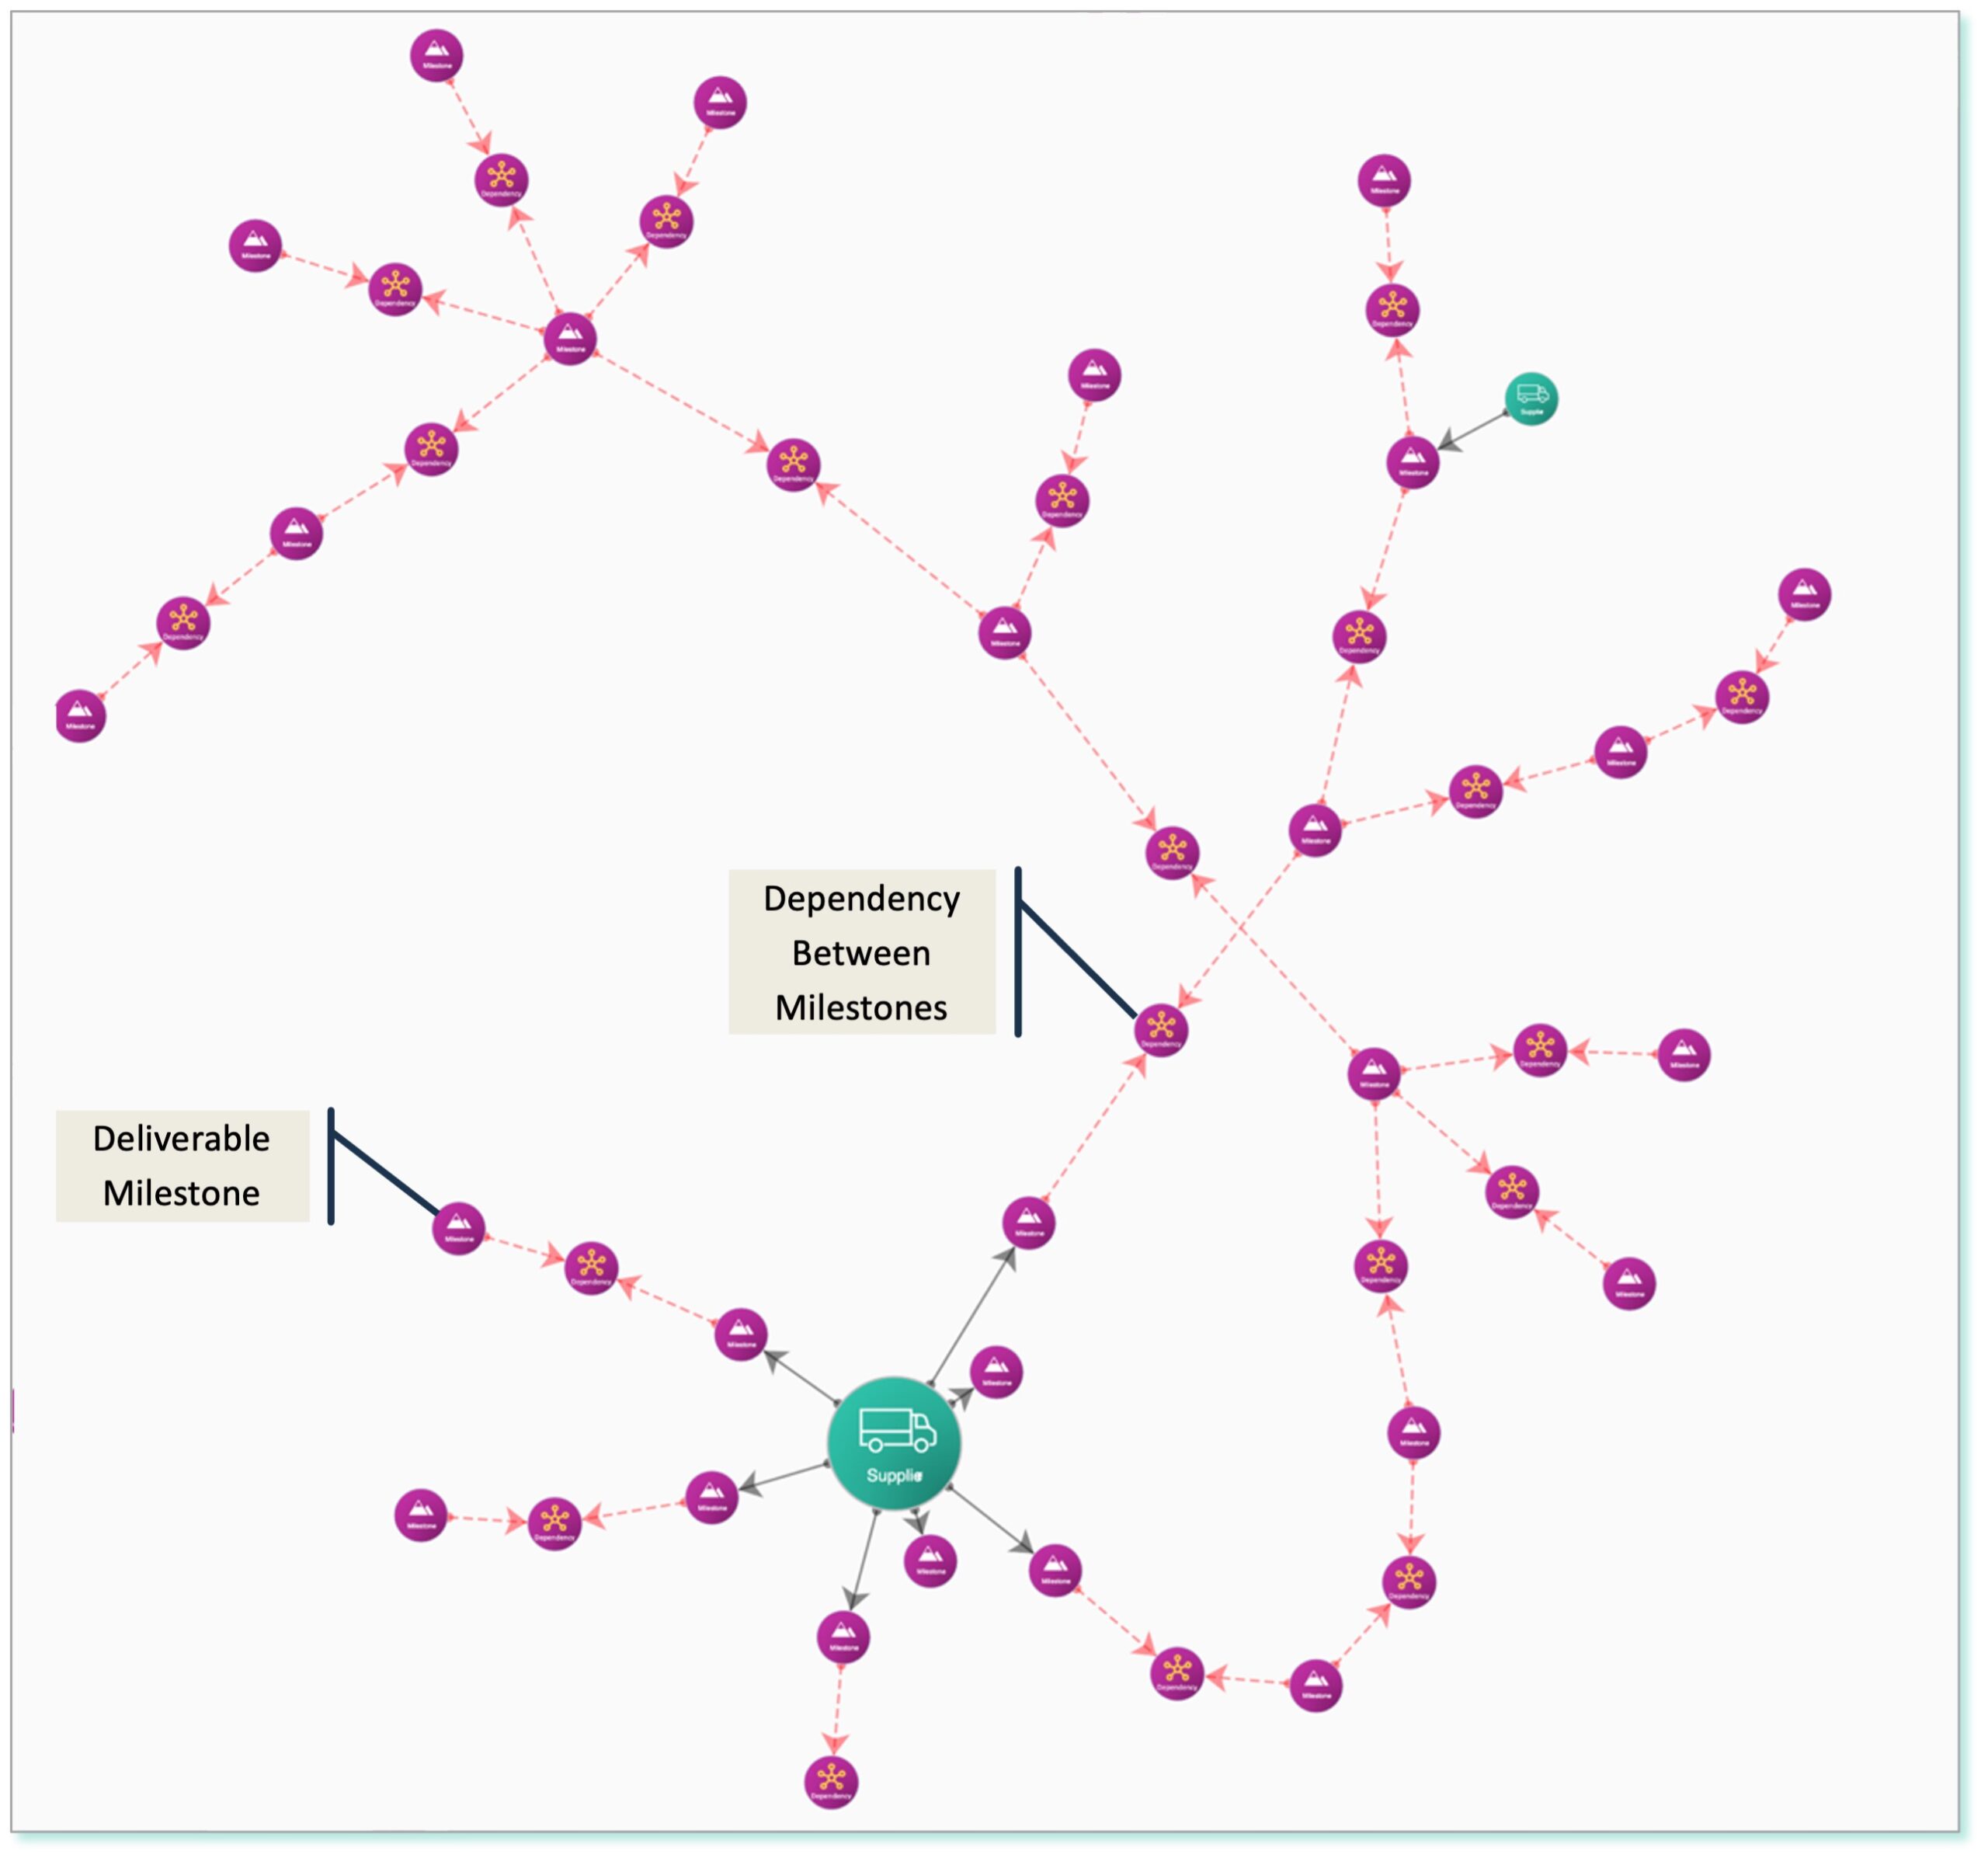
Connect can expand the above image to include any number of other Component Types, to show (for example) what all the milestones are connected to (e.g. projects, tasks, business functions, objectives, etc), revealing all the activity associated with the connected milestones across an organisation that would be impacted should that supplier miss a delivery milestone date.
The image in Fig 3, and the functionality that sits behind it is unique and provides the type of “next generation insight” that is essential if you want to address the problems touched on in the “Your Challenges” page, as it shows all the things that may fail across the organisation because of one individual failure.
The consequences of one supplier failing to deliver on a given milestone can be seen and understood by everyone that may be impacted across the organisation, and appropriate, timely action taken to mitigate the associated risks/issues. This does not have to be managed centrally, as live contextual information is given to all users of Connect.
The capability that has been described here shows one aspect of how Connect helps your organisation become Business 4.0 ready.
Some of the Really Cool Stuff
We have shown some of the great things that Connect can do to help your organisation in the sections above:
The delivery status of anything – an organisational strategy was shown in the “Power of Connected Components” section above, but this could have been more focused, e.g. the delivery status of an OKR, a Portfolio or a Programme
How data visualisation is used to cut through the complexity of your entire organisation and focus on specific areas – the impact of a supplier that fails to deliver as required was shown in the “Cutting Through Complexity” section above.
Below are some other examples of what makes Connect both unique and a powerful tool that can make a positive difference to your organisation.
1. Governance Forum performance effectiveness monitoring
By “Governance Forum” we mean any regular meeting that is part of an organisation’s governance framework, from Board and Executive Meetings at the top of the framework, through different committees, steering groups, project boards, down to weekly team meetings.
A programme, for example, may have an issue that its management team cannot address. Usually such an issue would be escalated to that programme’s steering committee (or programme board). If that governance forum cannot resolve the address the issue then it is escalated to the next governance forum in the hierarchy, and so on.
The programme needs the issue to be addressed efficiently and in a required timescale.
When a governance framework is not effective, the programme plan may be compromised or in extreme cases the programme may fail to deliver what is expected.
Governance effectiveness is often ignored, or put in the “too difficult” box, but is an essential factor in the management of successful outcomes for an organisation.
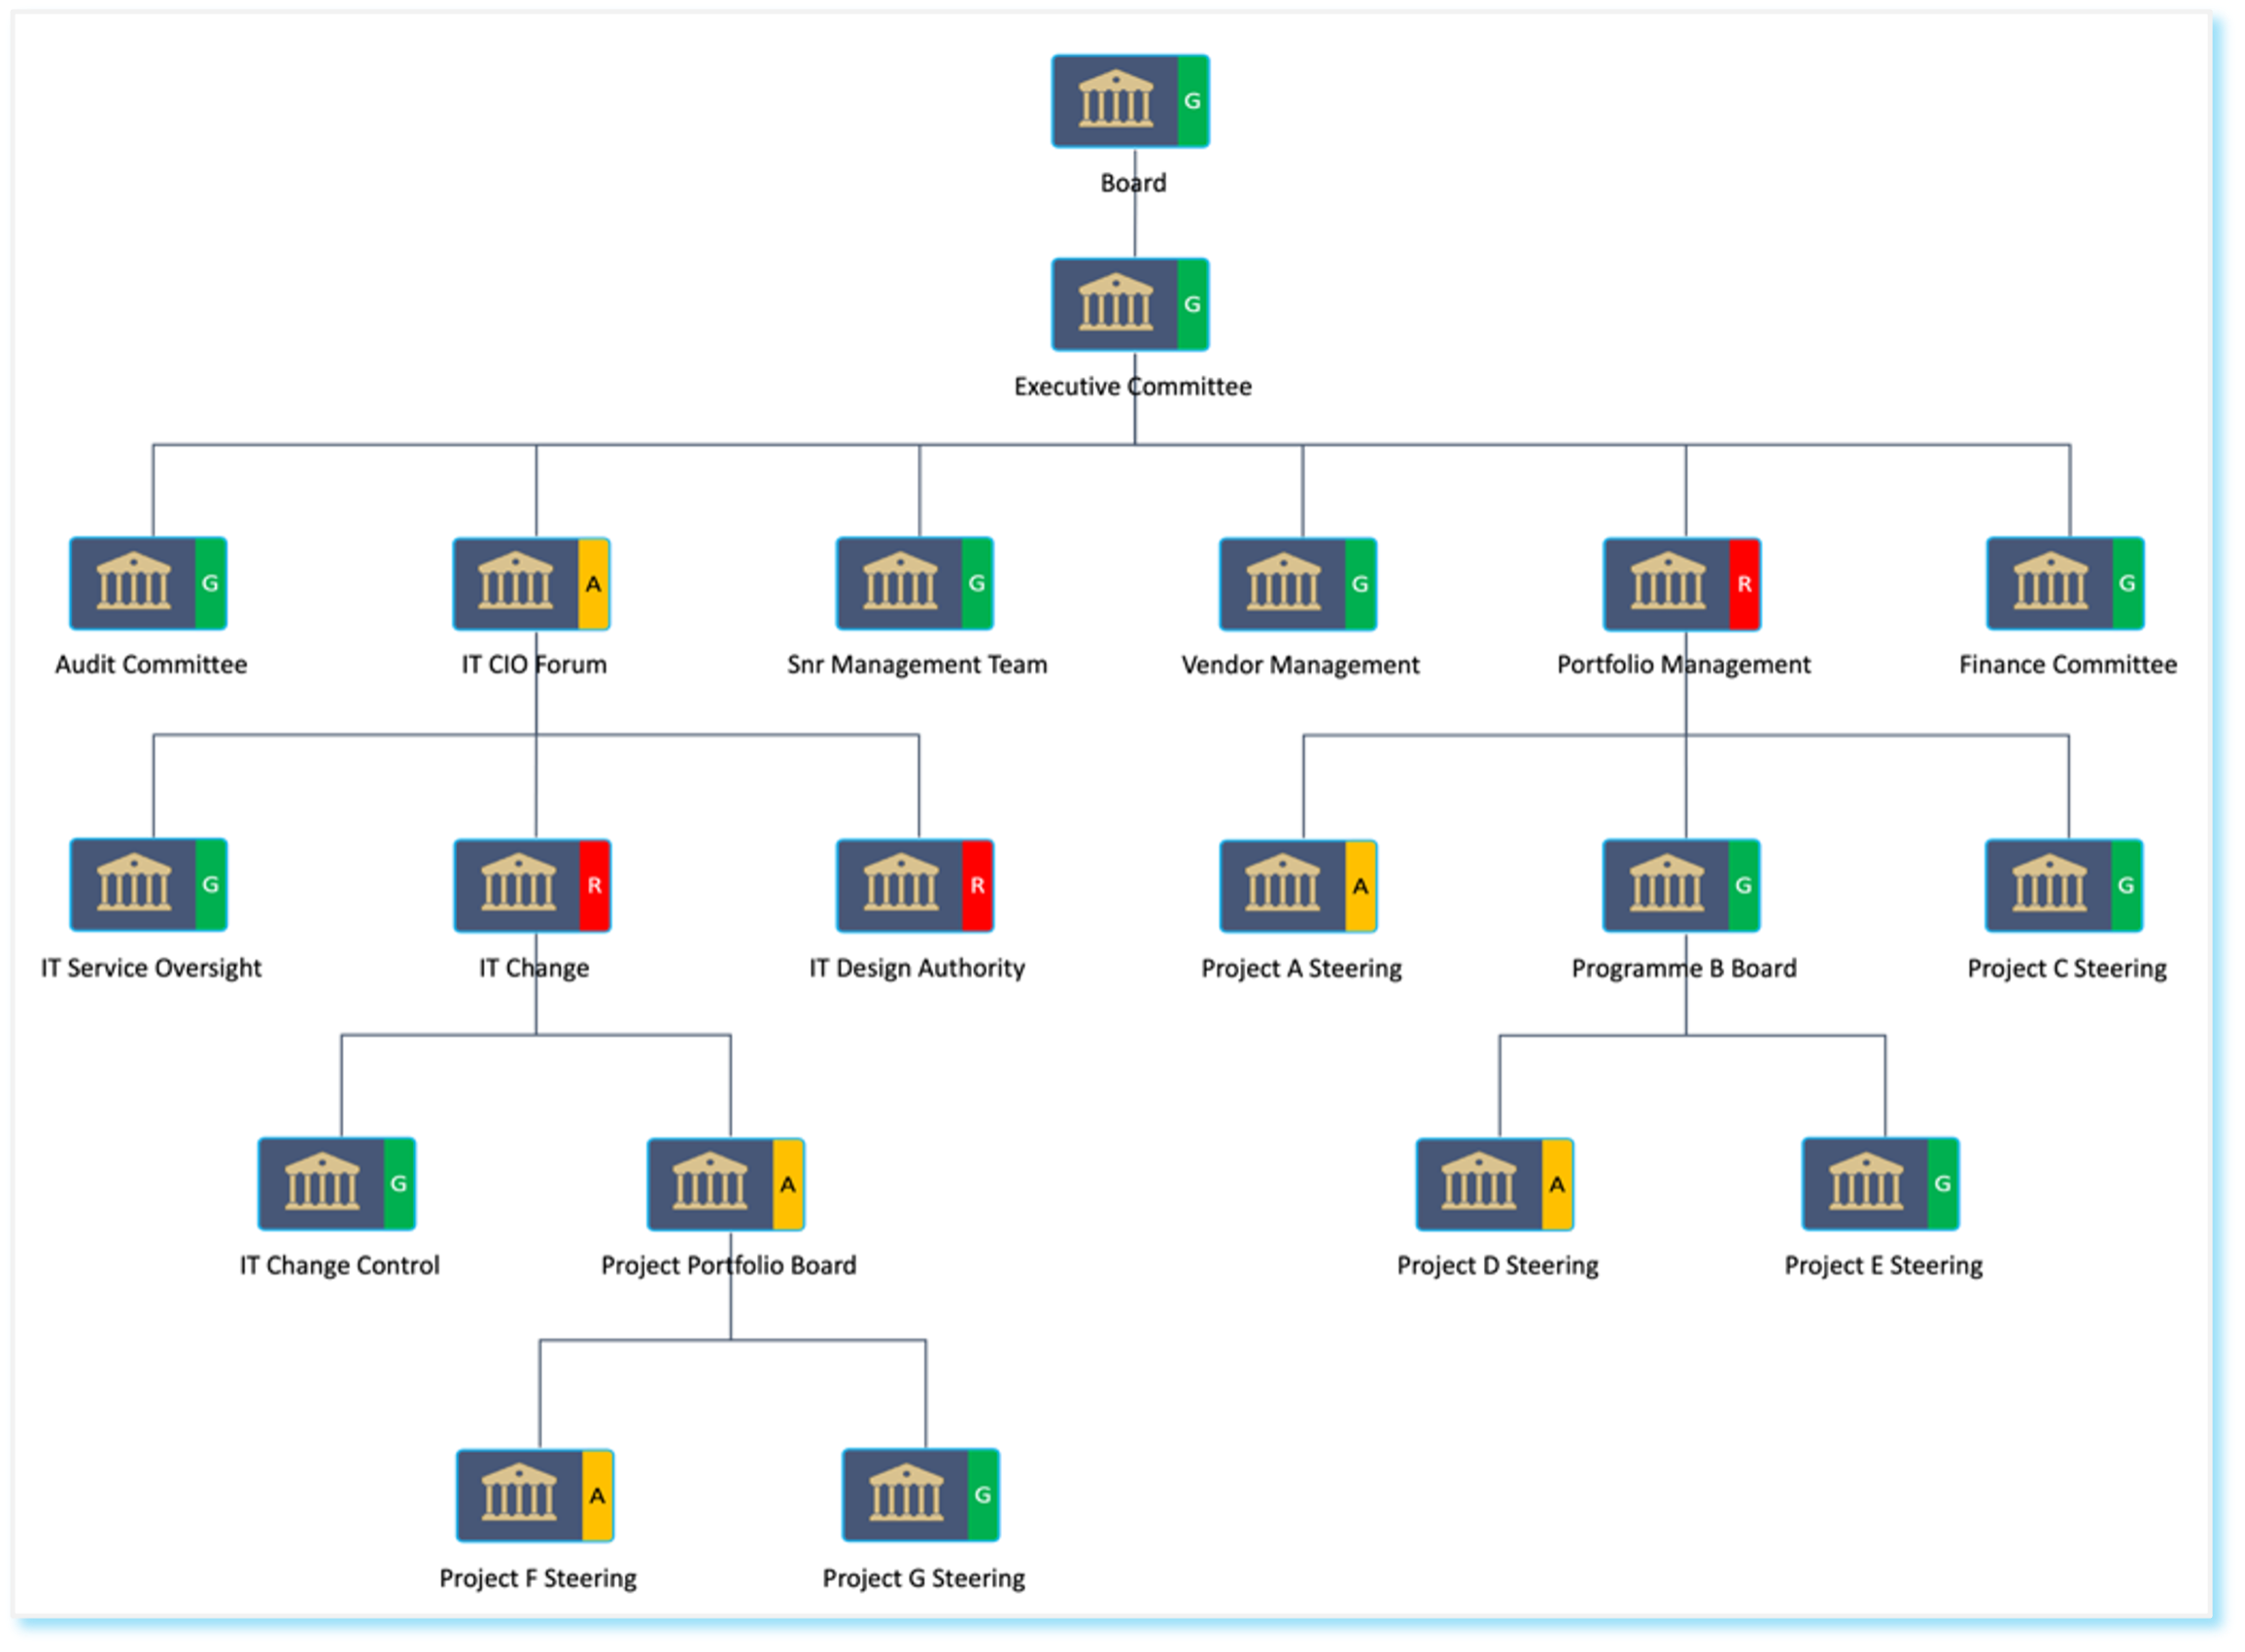
Connect’s Governance Component Type has comprehensive functionality to track a number of key indicator’s of effective governance, giving a data driven assessment of a governance forum’s performance.
The report below is automatically created by Connect, and shows the performance status of all the governance forums that have been chosen to be included in the organisation’s governance framework, held in Connect (the colours to the right of each forum).
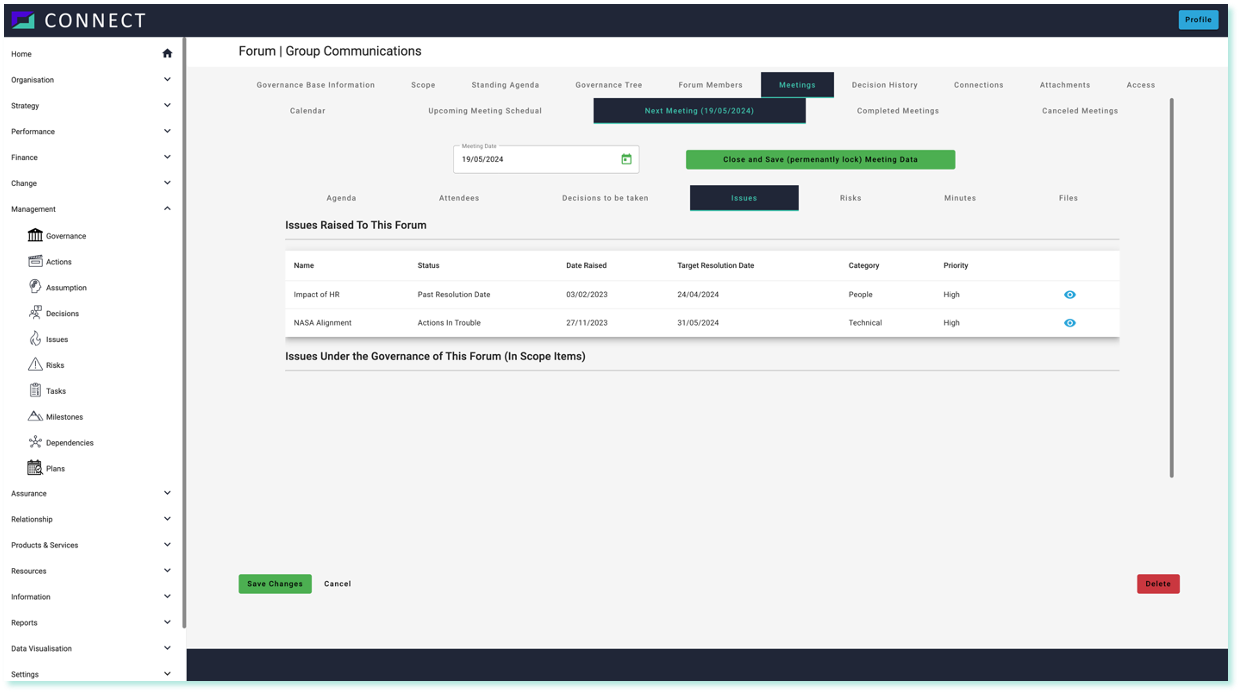
Each forum Component has comprehensive functionality behind it that allows the performance of any forum to be tracked. The example below shows the issues that have been escalated up to this forum for attention. These issues appear here automatically when an issue Component is marked for “escalation”.
2. Automatic Gantt Charts containing ANY time-bound Component
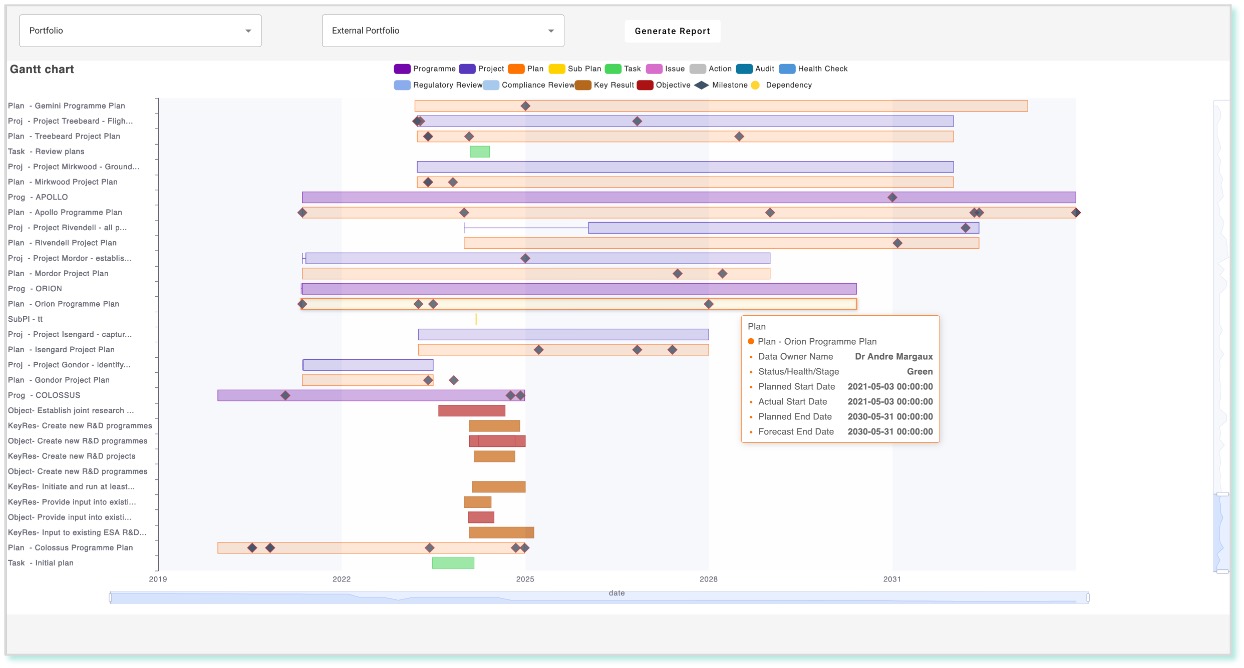
Connect enables you to automatically generate a powerful, interactive Gantt Charts for any scope. For example, you can create a Gantt Chart for everything that is contributing to a strategy, a goal, an OKR, a programme, a project, or as in the example below, to a portfolio.
Gantt charts typically show planned activity in the structure of a project or a programme, going down to individual tasks. Connect “knows” about all connections across an organisation that are-time bound (that have a start date and an expected end date). Hence when a Gantt chart is generated for say a Strategy, every Component that is time-bound is included in the Gantt Chart.
You can switch-off Component Types that you do not want to see (the block of colours at the top of the report below are on/off switches). What this means is that the Gantt Chart generate by Connect will automatically include things like Issues, which have a date raised and a target resolution date.
So, if Connect is requested to create a Gantt Chart for an Audit, or Health-Check (review) it will show the start and end dates as a line on the Gantt Chart for the Audit or the Health-Check, but it will also show all the issues that emerged with the expected resolution dates, and for each issue also plot the resolving actions (start and expected end dates) that are associated with those issues.
This means that Connect can be used to generate, automatically, Integrated Audit Assurance Plans (IAAPs) to a very granular level of detail.
3. Live view of performance against budget across the organisation
Connect tracks where a budget has been allocated and broken down across an entire organisation. It also supports the budgeting process, by showing how budget planning is evolving across the organisation.
We use the terms Root (the overall budget of the organisation for a given year), Branch (a distribution of the central budget, e.g. to a department) and Leaf (the point where a budget will be used and managed.
Connect’s Budget/Cost Component Type has comprehensive functionality to manage the entire budget structure of an Organisation, or it can be used in a localised manner to manage the costs of say, a department or a project.
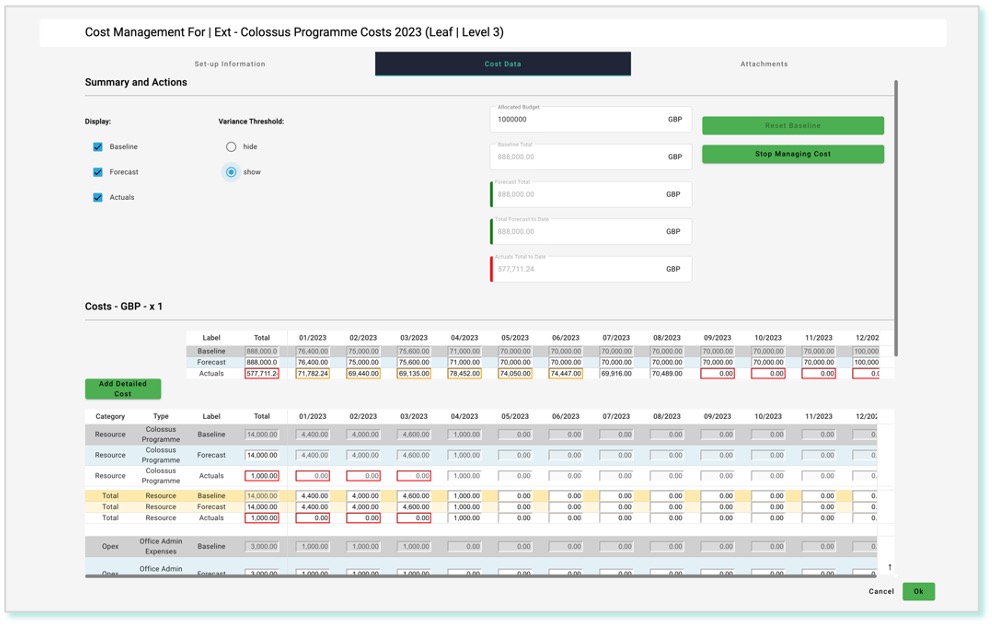
Baseline, Forecast and Actual costs can be tracked with user selected update frequency. Users can define in settings how they want to group costs (e.g. Capex and Opex) and what the individual cost types are.
Where the Resource Component Type is utilised in connection with for example, a project to capture baseline, forecast and actual times, and translating these into resource costs, then the resource related costs are automatically added to that project’s Budget/Cost Component. This means that when the actual number of hours that a person has spent on something are recorded, the associated cost is instantly reflected at all relevant points in the “Budget Tree”.
In the automatically generated interactive visualisation below, the user is able to instantly drill down to the Component that sits behind each element of the tree (Root, Branch and Leaf).

The above visualisation in Connect is interactive and you can drill down from any point on the tree (Root, Branch and Node) and go to the related Component and all the associated data and functionality. The example below shows one of the screens that is shown when the “Ext – Colosus Programme Costs 2023” is selected.
4. Report on the “riskiness” of anything in Connect
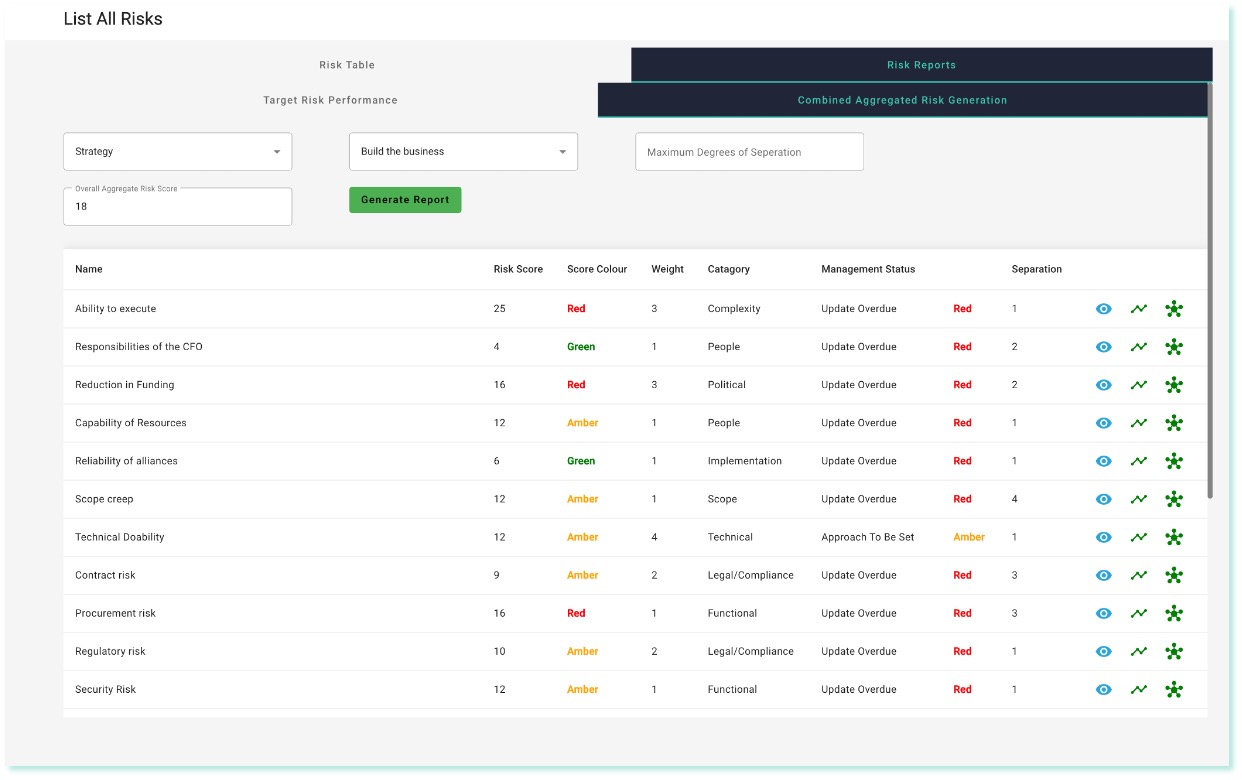
Connect can aggregate all the risks associated with any aspect of an organisation, such as a Strategy, a Portfolio or a Programme and give it an overall risk rating based on all the underlying risks.
It also lists all the risks included in the calculation along with the “Management Status” of each risk which indicates how well a risk is being managed (another key feature of connect).
With this information action can be taken to improve the management of risks that contribute to a high aggregated risk score where these exist.
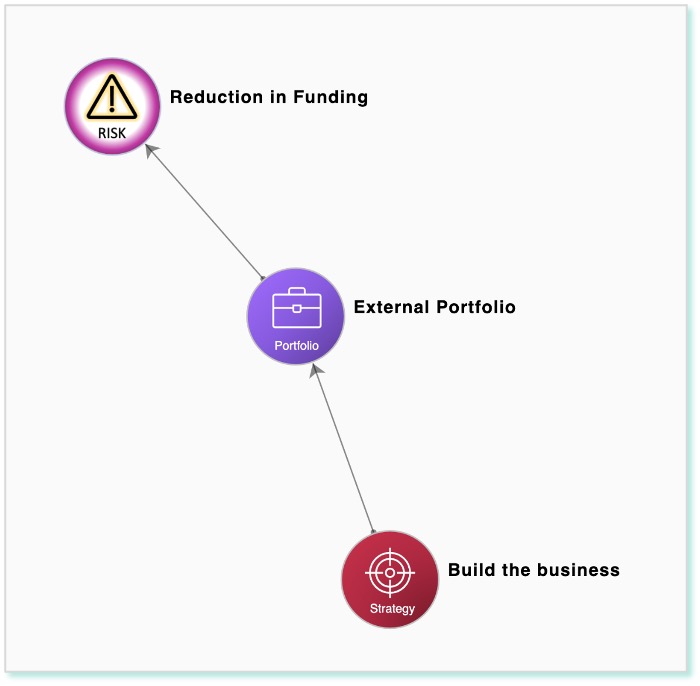
The view below is instantly generated by Connect. The extract at the bottom shows the calculation path for one of the included risks.
CONNECT Functionality
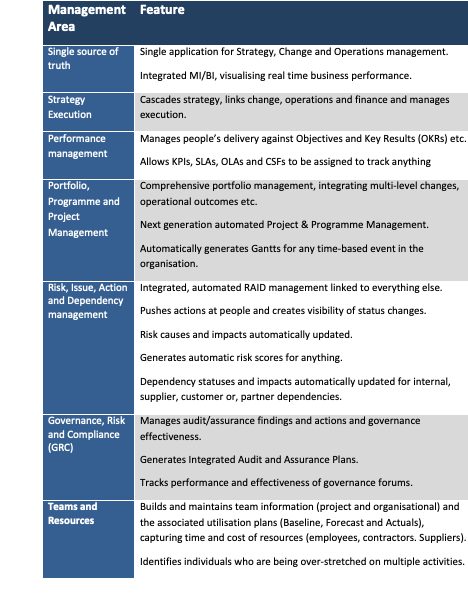
Connect does what multiple existing tools do but, crucially, allows them to inter-operate as a single management system. It also has functionality that does not exist in other tools. This scope is depicted below.
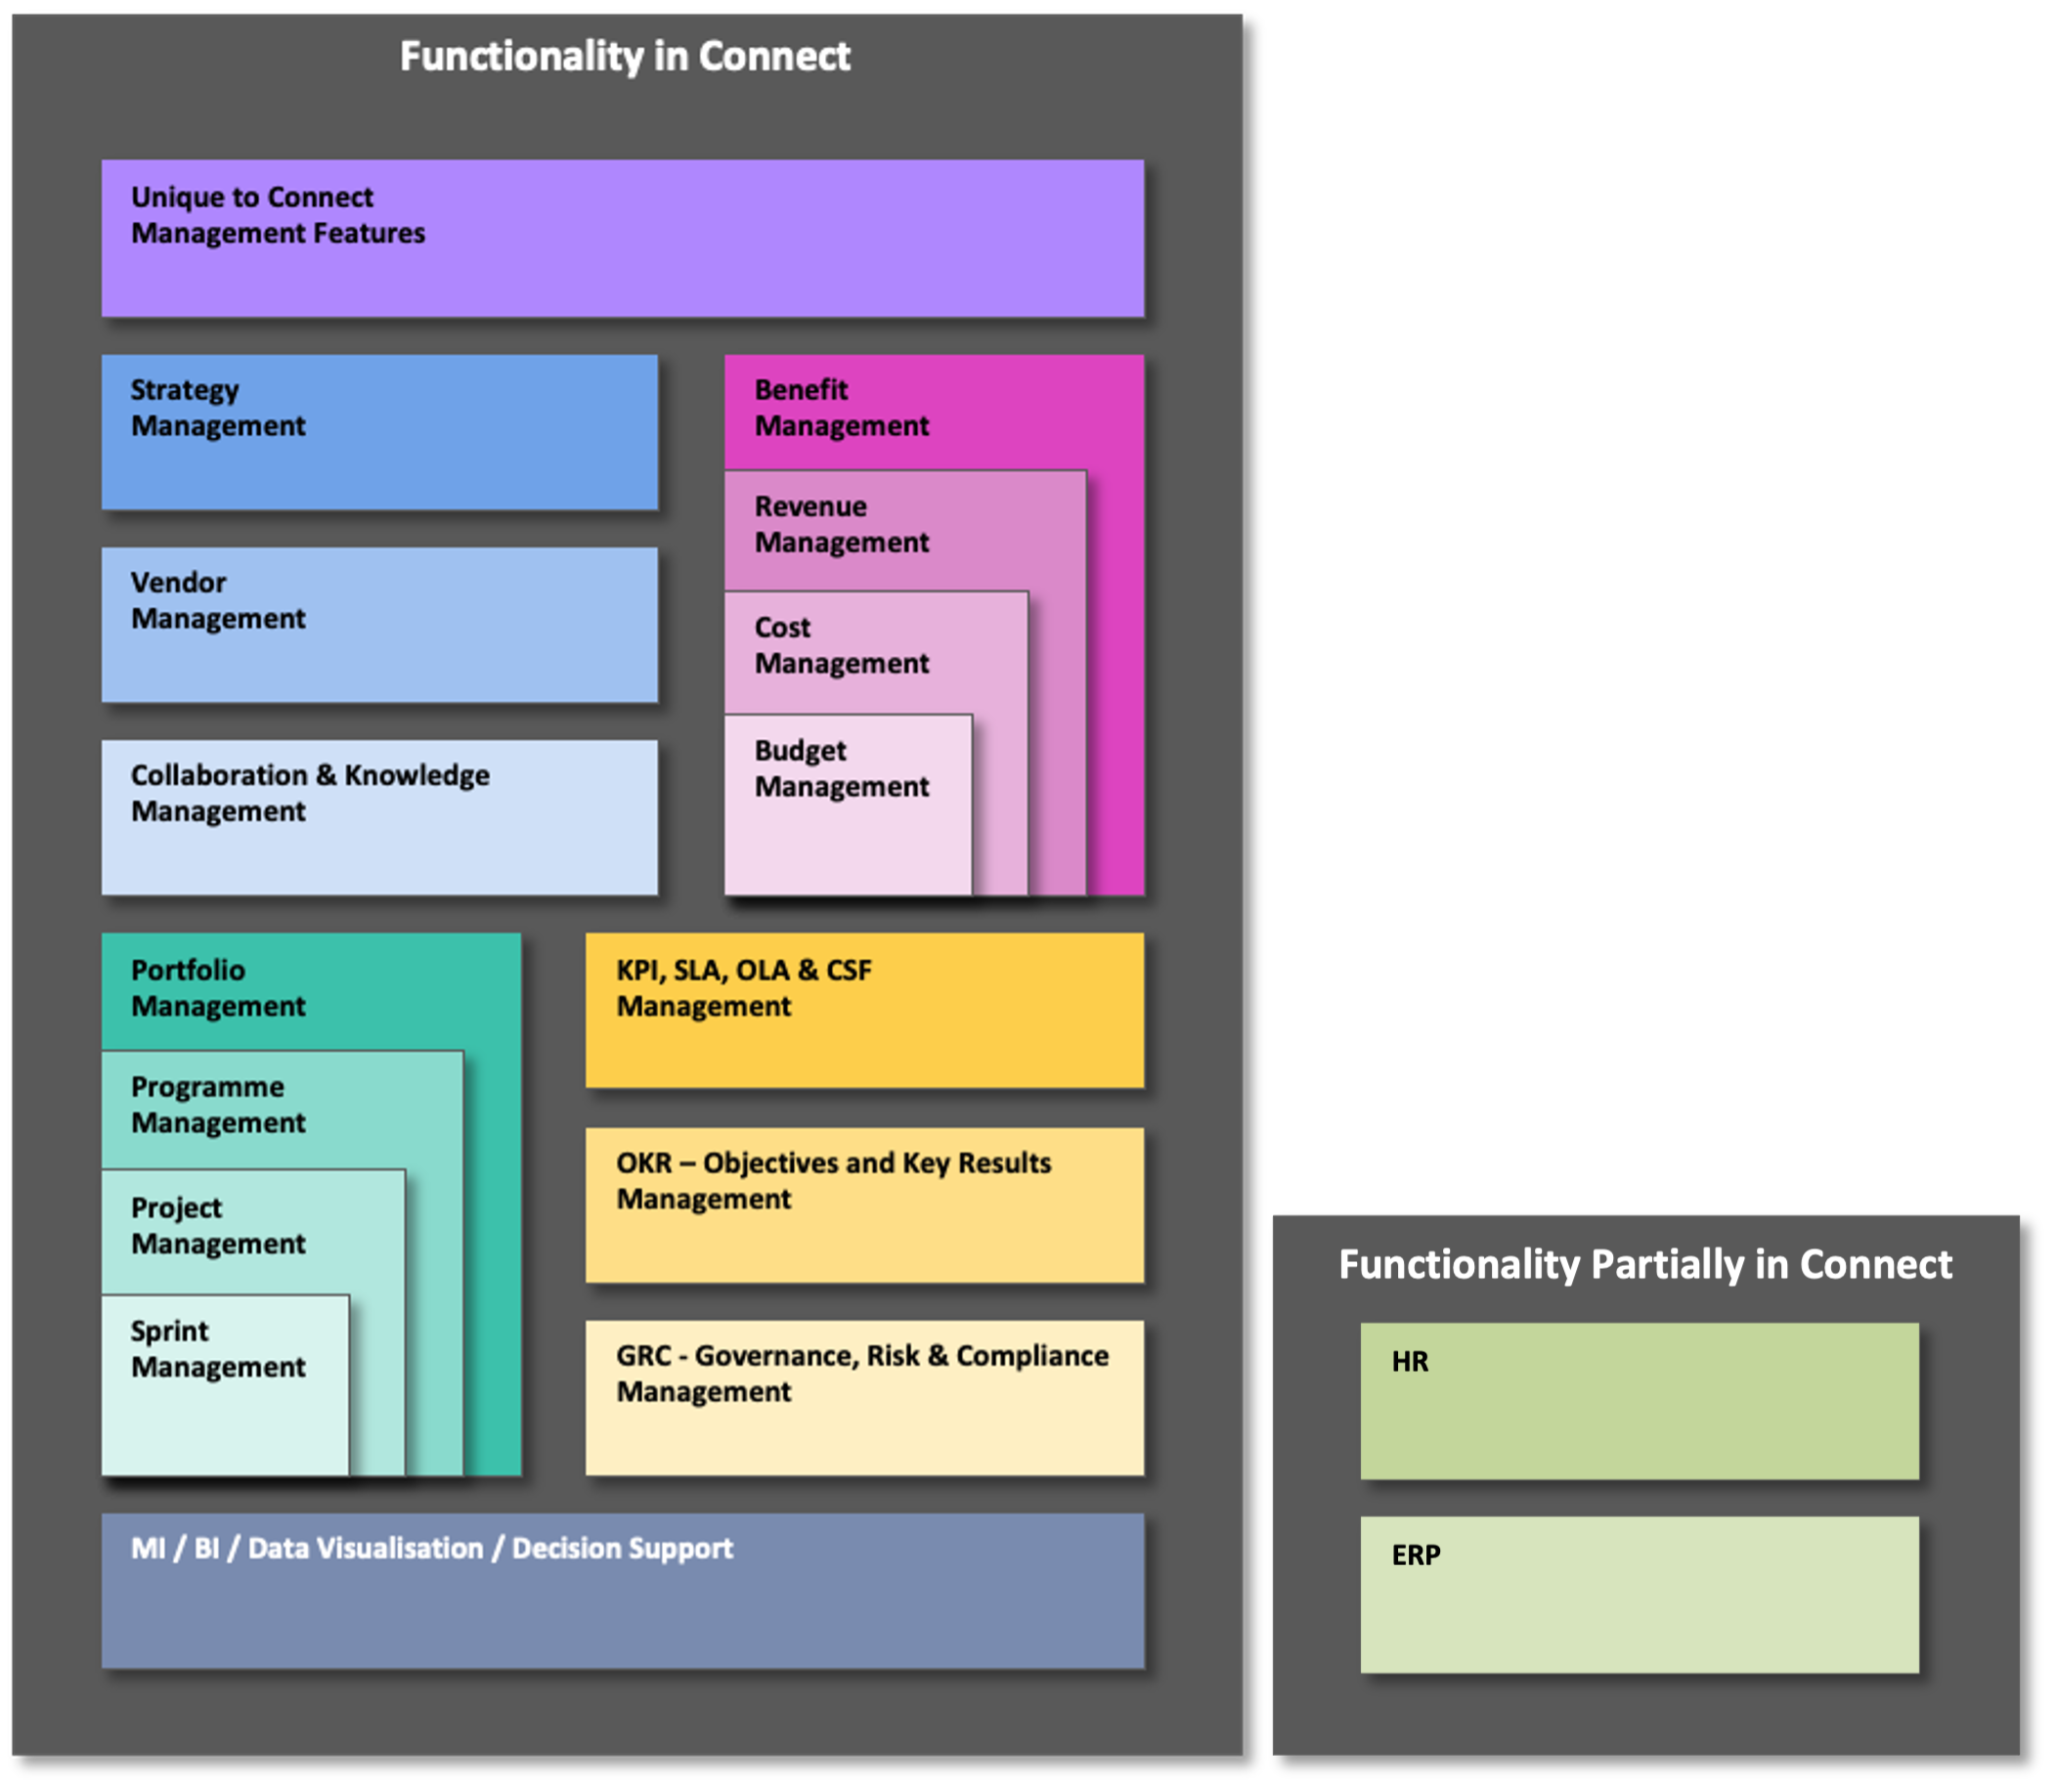
Connect integrates the functionality and information processed by these tools, thus removing the silos that normally exist between them.
Executives and managers have live access to a complete picture of how the entire organisation is performing. Each user can create their own views of what matters to them across any aspect of the organisation – delivering next generation decision support, based on a “Single Source of the Truth”.
Organisations will probably already be using their own tools for some of the application scope described above. Data can be imported from other tools into Connect.
All the functionality depicted above can be used “out of the box” and at no additional cost (all Connect functionality is included in the standard Connect Subscription).
The following selected features are some of those which make Connect unique. Connect also has comprehensive features that will be familiar to users of a number of different types of management software tool.
